Houston we are ready for the takeoff in 3,2,1
Here we go once again, talking about everyone’s favorite in small caps: The strong cycles. Regardless if you are a short seller or perma bull you probably enjoy trading around those market conditions the most, even if they end up hurting you (Stockholm syndrome says hello), because at least you know some other opportunity might be cooking up around the corner for redemption until the hot momentum lasts.
Strong cycles have their sequence structure, and if you observe over many samples it tends to repeat quite well. That does not mean it gets easy to extract the edge it is just that the spawn rate of tickers and distribution of particular themes has its order, well at least sometimes.
The problem is that over few years period, the duration/length of those cycles can change so much (2X or 3X multiple) that it impacts your adjustment skills significantly. Meaning even if you are an experienced observer of this market niche, if all of a sudden cycles get to be much shorter (as they are over past 12 months) it requires that much quicker adaptation to sort which stage of the cycle should be next, and what type of tickers might follow that it gets easier to make mistakes.
The shorter the strong cycles, the quicker trader might eat big losses (as big squeezers stack up quickly) and the less chances you have for redemption later because cycle just doesnt last long (few days only) and momentum dries out too quick. This is why for many ultra-feed of strong cycles constantly in 2021 was not as much issue as it is 2022-23 when those cycles have prolonged period of idle momentum for 2 months, and when they show up, they equally fast leave the scene. Hi, bye.

The basic rule that applies to any market is:
The lusher the liquidity conditions, the longer the strong cycles get, the more room you have to make mistakes, and the more chances you get for redemptions. Strong cycles last longer, have more opportunities, and most importantly one has time (no pressure) to figure out what’s next.
When liquidity conditions shrink, the strong cycle lengths do as well and now all the time pressure of figuring out the next stage of the cycle increases significantly. You have to be faster, which increases the chances you will be poor on timing. This is where we are so far over the past 6 months in small-caps. As mentioned in prior articles I do believe we will stay in this condition for another 6 to 12 months.
Key 2022/23 takeaway for strong cycles:
Duration: It is shrinking. Instead of 3 weeks of common strong cycle duration in 2021, now we have just several days in total of lasting duration.
Liquidity: is still very high, semi-2021 style (much higher than 2018 for example). Volumes are still very high this year on average.
Leading tickers topping time: Is quicker. In prior years to 2022, it was common for lead tickers to take several days or even two weeks to complete their journey towards 1000%. Over the past year that journey has shrunk significantly, where leading tickers quickly expand parabolically really fast. For example, CXAI (lead AI ticker) has reached above the 1k% threshold in just two days since the movement began. The same applies to prior 3 strong cycles in 2022.
All of that contributes to shortening the duration of the total cycle. Because once the leading ticker tops out too quickly and momentum is killed, it impacts every other ticker down the road.
Hot sectors: Lesser in numbers. We had fewer hot themes in broad markets over the past year which are key to creating strong cycles in small-caps. They are not a must, but they surely help the most.
It is no surprise why strong cycles were lesser in numbers and shorter in duration. If large-cap liquidity is lacking and nothing is hot out there (bear market in large caps 2022), small-caps will as result feel that lack. Regardless of how much people believe small-caps can do just fine on their own, it isn’t true for strong cycles and hot momentum.
It all starts on top of the pyramid and then trickles down to small-caps. If you want hot momentum in small caps, large caps need to get taken care of. This is where the AI theme recently came and contributed its share for example, along with SPY being somewhat neutral/strong at the same time.
The above observations are key so that one walks into every new strong cycle down the path of this year with the right expectations. Observe the downtick in momentum or adjustments for that matter to build the right expectations. Wrong expectations can make you overstay your longs, or approach shorts too early and get squeezed. This does not mean the conditions of 22/23 will absolutely persist and mimic in 23/24 but until there is obvious disconnect assume that they might. Macro environment is likely to remain the same or worsen.
Stage 1 (the awakening):
Pay attention to the hot sector theme (fundamentally), it will be key usually to ignite strong cycles. Not always, but more often than not. It provides you heads-up before things start to move (hot sector in large-caps not small-caps).
Summary on behavior: Stronger intraday squeezers that just do not fade and often close strong.
It usually all starts with some hot sector theme in the broad market getting a lot of interest. Not just interest, because that’s not what moves the markets, investment money starts to flow. Big companies start to pour large sums of capital into buying up the deals with whatever that hot sector is (sometimes governments directly), which then pushes this sector and a bunch of large or mid-cap equity tickers into strong up trends.
Those uptrends typically have to last for 1 month before the excess gains and money starts to then trickle down from those large-cap tickers into small-caps. This is important factor to understand the timing aspects of small-cap cycle ignitions.
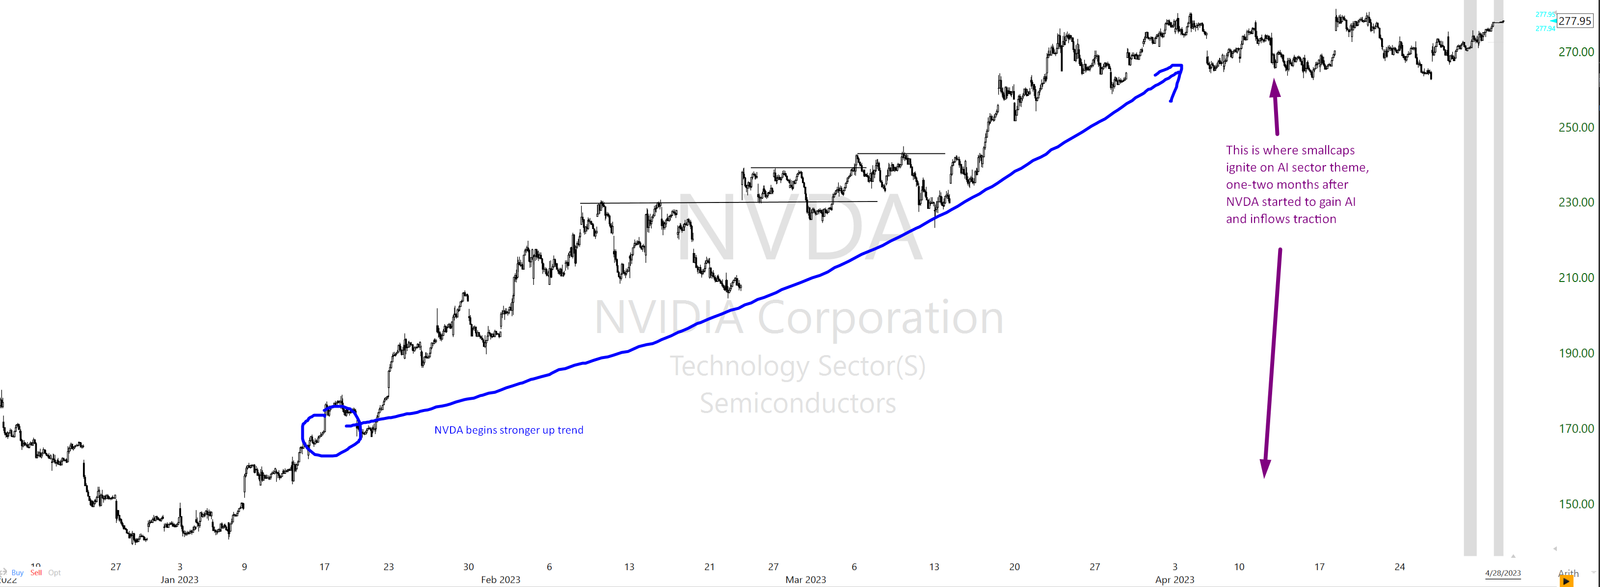
Large caps establish the tunnel forward and the small-caps join the party usually about a month later. Understanding this process is key to time early strong cycle ignitions well and connections to the most likely theme that might ignite them (which in the case of this article was AI).
ChatGPT release had lots of AI coverage in media-Microsoft and other large companies started to invest billions into AI tech-tickers. NVDA and AI become leading large-cap tickers with AI theme-bull trend lasting for month-and then the flows started to trickle into small-caps, igniting bunch of AI related small-caps slowly and then fast. AI is just the theme/sector used in this article as example of most recent strong cycle. The same timing sequence applies to all other hot sector themes we have seen in prior years.
This sequence is very similar in all strong cycles that are ignited by a hot sector theme.
Examples of such being:
-Solar energy 2021 (SPI leading strong cycle ticker)
-EVs 2021
-Oil 2022 (IMPP leading strong cycle ticker)
-AI 2023 (CXAI leading strong cycle ticker)
etc…

Being aware of current hot sectors present in broad markets helps a lot to establish early smallcap strong cycles or at least which tickers could be proned to it, because its never a guarantee for anything to happen.
Observing my mistakes, I can say that not being aware of what is currently hot sector out there in the non-smallcap market reduces your chance of recognizing strong cycles in small-caps by 3 days often (issue for short sellers often), and by that time you have already done some damage by underestimating tickers probably. So track those things. Yes, people say that “small-caps are their own thing”, but not really if we care about details and cycles. Being aware of broad market sentiment and especially the hottest things out there have benefits to cycle shift recognition.
The duration of the bull trend in leading large-cap tickers of hot sector should be one month before small-caps get interested and “trickle down flows” begin.
A recent example of an AI hot theme would be where ticker NVDA has been for one month in a strong up trend, meanwhile, SPY also stabilized and there was a ton of media coverage for the AI theme. It took one month of persistent pressure as such to ignite the smallcap strong cycle. This is how it often works. This is why you should be paying attention to what those leading tickers of large caps are doing to prepare for the potential ignition of the strong cycle of small-caps ahead.
NVDA chart below and the timing where strong cycle in small-caps ignited:
Once you have established that hot sector-theme is in play in small-caps, be careful with forming too bearish opinions on tickers that will belong to that sector (if early into cycle), once they start to move. Be open-minded on those as much as possible, regardless of how fluffy the PR is. Remember that some tickers will squeeze big time even without any PR (CXAI).
Stage 2 (After-hour runs):
Summary on behavior: One or two high liquid / higher volume tickers run intraday and close strong. What follows next is AH runs. This is unique in small caps and only usually happens in this particular phase of the strong cycle, at least to a high % extent.
This is where momentum opens up. Things are no longer just moving within 150% ranges, but instead now as well have strong AH or PM gap ups on relatively low volumes.
AI strong cycle of April is not best example to highlight, because leading ticker CXAI had strong AH run and right next day it also topped out, due to extending abnormal % amount quickly. But in prior strong cycles it is more common to see strong AH run on one ticker followed by 1-4 more days of strong momentum and AH runs on other tickers, before the cycle is done, as typically it will take still few more days for leading ticker to get above 1000% of total run.
Stage 3 (parabolic on leading ticker):
Summary on behavior: When the leading ticker extends 1000% this is it usually done into the parabolic move (check parabolic article for that). This is the top of the cycle in most cases. What follows next is unwind of mommentum on daily basis by certain % amount. Lower range, lower range, lower range, and then several days later now the volatility and volumes are much lower than several days back.
The leading ticker of the strong cycle will usually top out around or above the 1000% mark or perhaps somewhat higher, but usually not much more than that. The point is it’s not that it matters if the ticker will top out exactly at 1000% or 1200% or 950% that matters, what matters is once it gets very close to the 1k% level, the top will be usually only a day or two away. This is usually the iceberg of the strong cycle in front of you.
For example, some tickers do pass above the 1000% mark, but they will not stay above that for long at all, and will most likely unwind within the next 2 days, and unwind hard.
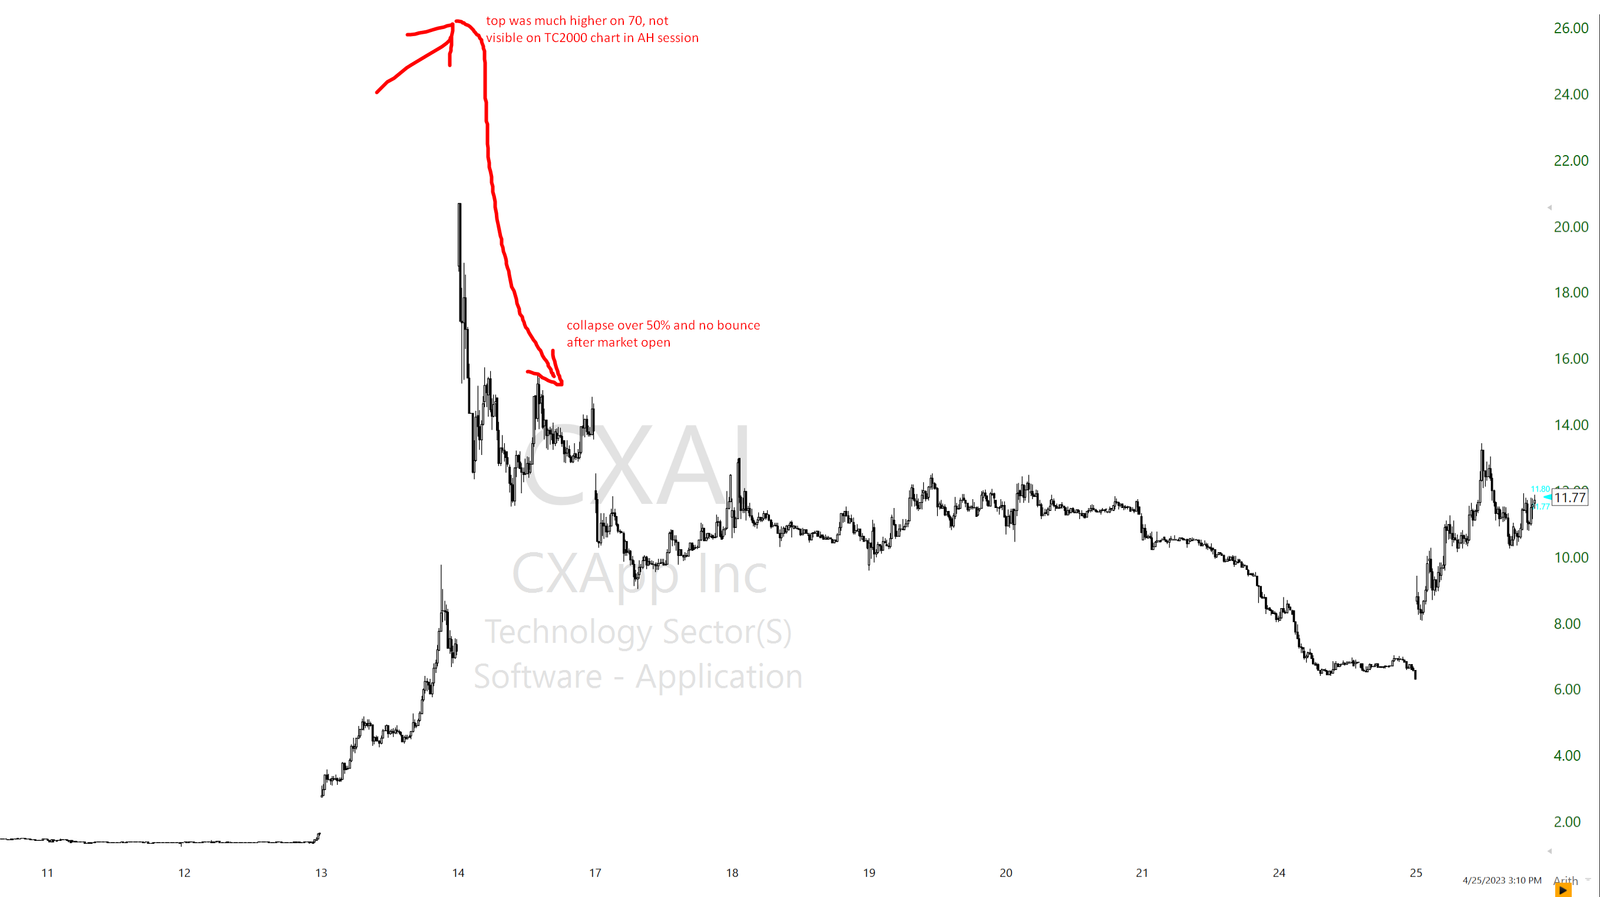
For example, CXAI while it did achieve an exceptional 5000% move from the base up, once it crossed the 1000% mark, it topped out at 5000% on the same day in pre-market and that was it. That was the top. IMPP the lead ticker from strong cycle of March 2022 (energy sector) similar. Once it achieved parabolic squeeze into 1000% it topped out on that day:
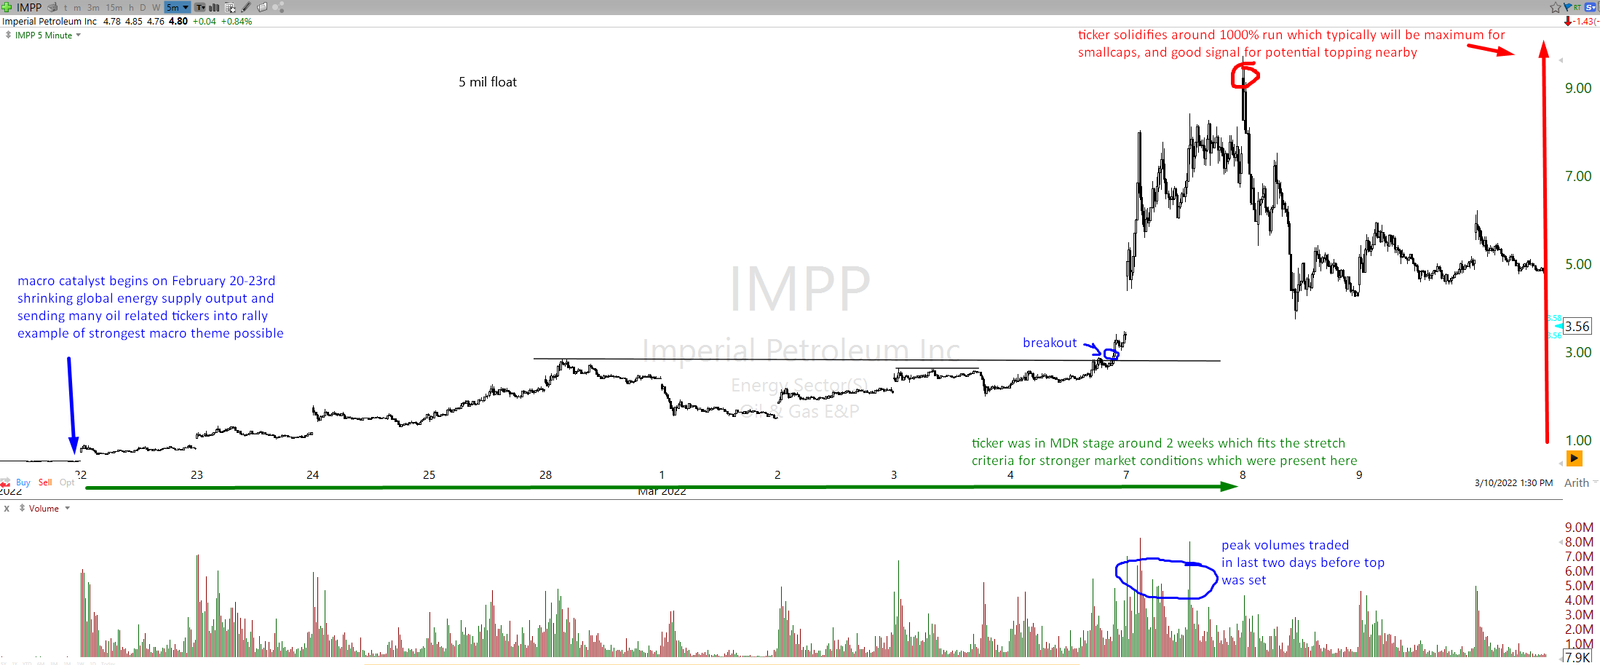
This is why being aware of that % run the leading ticker is currently achieveing is actually relevant to timing the cycle.
Why does this happen? Is there something mathematical to order flow that it becomes too expensive for market makers to sustain orderflow and buying activity above 1000% and parabolic move (vertical climb)? Perhaps, we can speculate on that, there has to be a reason. And whoever is deploying massive amount of buying powers to squeeze tickers like that parabolicly (not retailers) is the only one with exact answer on that, which means we wont get it.
The conclusion is always to pay attention to that 1000% level on leading ticker and do not form any “this is crazy and this cycle cant last more” type of argument until you see the leading ticker passing that threshold.
Most strong cycle tickers do not go up just 200 or 400% (from their initial base where the move began). They go higher.
This mental exercise requires a ton of flexibility because it is completely understandable why many operate with an “it can’t go higher” mindset so early into strong cycles.
It’s because there have been large clusters of data in 1-2 months before where no ticker has made an exceptional move, and then when a strong cycle shows up all of sudden not just one ticker but many start to break those prior averages significantly, in a row.
It looks strange because you are binding the current behavior of a new/different cycle to prior behaviors of different (colder) cycles. It’s easy to draw the wrong conclusion. In crazy times, expect things to go crazy. When times go back to normal, keep in mind, normality is constant until it is not, and every once in a while it is not. It’s all about cyclicality. Normal, normal, normal, normal, crazy, crazy, normal, normal, normal, normal…repeat in the such or different mix distribution of sequence. If you isolate “crazy” historically and track how often it repeats you no longer see it as “crazy”, its just one of the in between cycles. And it is key to understand that it is cycle, which means it will repeat, it is not just one type of thing. It will show up again, every so often.
Stage 4 strong cycle unwind after topping out:
Summary of behavior: Strong early pushes in the first 2 hours followed by mid-day fades. Up and then down. Either that or just early all-day-fades (ADF).
When the leading ticker of a strong cycle tops out and collapses usually within a single day 30 to 50% (after reaching nearly 1000% run) there are two factors to understand:
-The drag effect
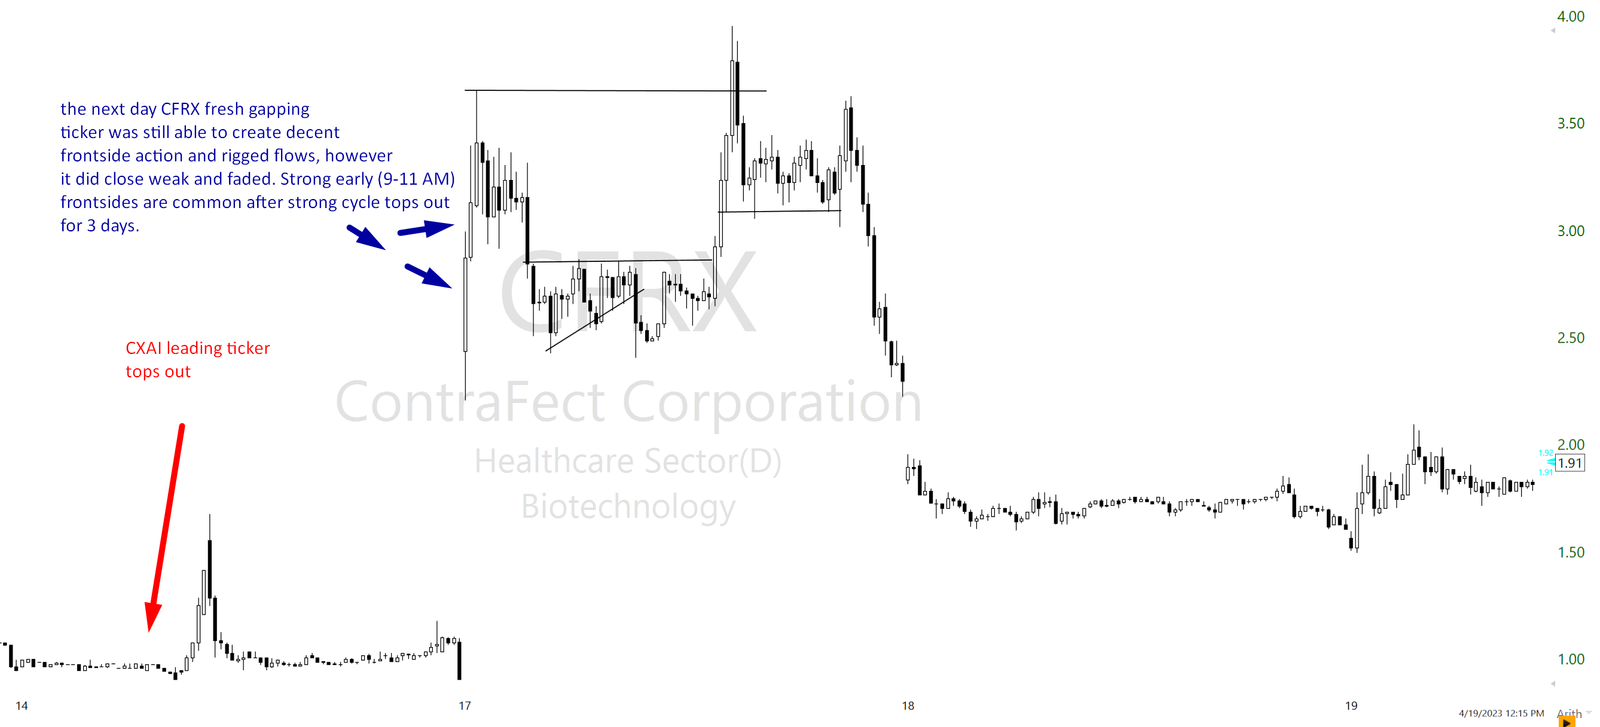
Once the leading ticker unwinds heavily on its first big red day, while momentum will spill red into other tickers on that day, the next few days the new fresh day 1 gapping tickers will still have good early upside moves often.
Usually what happens is tickers that are old and have started running at the same time as leading cycle tickers will follow the collapse of momentum with multiday weakness, but fresh gapping tickers will still trade with good early upside potentials. Even though those fresh gapping tickers might unwind by EOD, do not underestimate the % ranges of frontside they can still create. This is because of the drag effect. Once a strong cycle tops out, the volume and liquidity don’t just evaporate. It starts to downtick daily, but there is still plenty of capacity left over the next few days to deliver some good frontside moves on new tickers, before they do fade, if so.
This creates often in stage 4 of cycle this conceptual behavior of smallcappers:
-early strong squeeze, followed by mid or EOD fade

This means that often good expectation on D1 or intraday pump tickers is to anticipate inverse U-shaped move. First, move up, and then in the second portion of the day move down, roughly speaking.
An example of drag effect is that even if CXAI topped out and unwinded hard earlier the day, the next day fresh gapper of MRIN still created a decent frontside and high liquid move before it also topped out.
-Initial momentum collapse
This is more obvious to see. Once the leading ticker collapses, on that same day it will drag down the majority of old running tickers quickly (sympathies especially). This is what the topping days of strong cycles look like. Everything on that day falls apart, or a lot of tickers at least. Not everything falls apart quickly, but most will. Some tickers will fade harder in EOD instead of early when lead ticker also is done.
If you are longing late into the cycle, always pay attention to what the leading ticker is doing. Have it on your screen at all times. Recognize it fully which is the leading ticker in first place. If such a ticker all of a sudden starts to deflate hard, you better start looking for exits on longs of other correlated or less correlated tickers, EVEN if they are not in the same sector. This could be called the first red day momentum collapse on the lead ticker and its spill-over effect. Nothing is for certain and anomalies can happen, but probabilites are leaning quite high towards respecting this behavior.
-The difference between “fresh gapping” vs “old running tickers”
On the day that the lead ticker tops out, usually there are a few further days of still relatively strong momentum present on fresh gapping tickers.
It is key to differentiate here. The older tickers that were runners along the leading ticker and are now in d2, d3, and day4 moves decline along the leading ticker, but any fresh gapping-up ticker will still receive usually a good amount of early momentum over those same 3 or 5 days.
That flaming torch of a strong cycle although reduced to a good amount still has enough flame to squeeze tickers in the first few hours good. Its best not operate with the mindset that everything will quickly now fade just because the leading ticker has topped out.
While tickers yes will eventually be by the end of the day unwinding often, they tend to have good squeezes in the first half of the day. The fresh gappers that is.
Those first few days of the backside of the strong cycle will provide some of the best fading tickers, some of which will be ADFs (suggesting all-day faders that fade early from gates open) and some mid day or EOD stronger faders. This is because strong cycle “echo” still carries enough momentum to push them up early often, but is no longer strong enough perhaps to sustain the squeezes for whatever the reason.
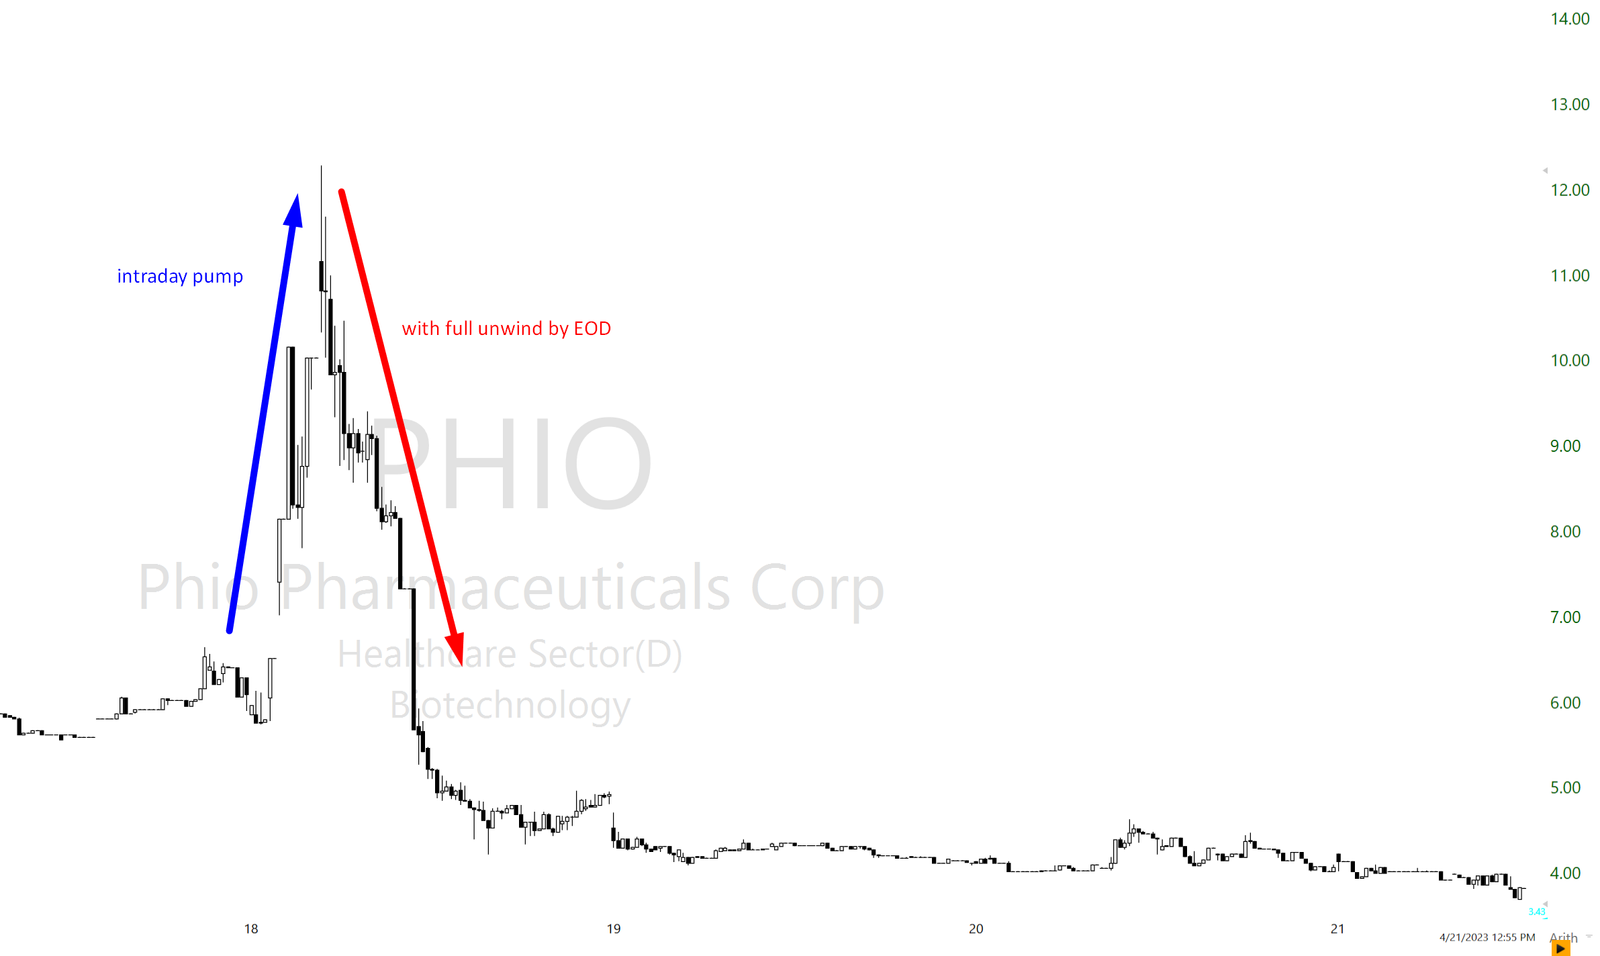
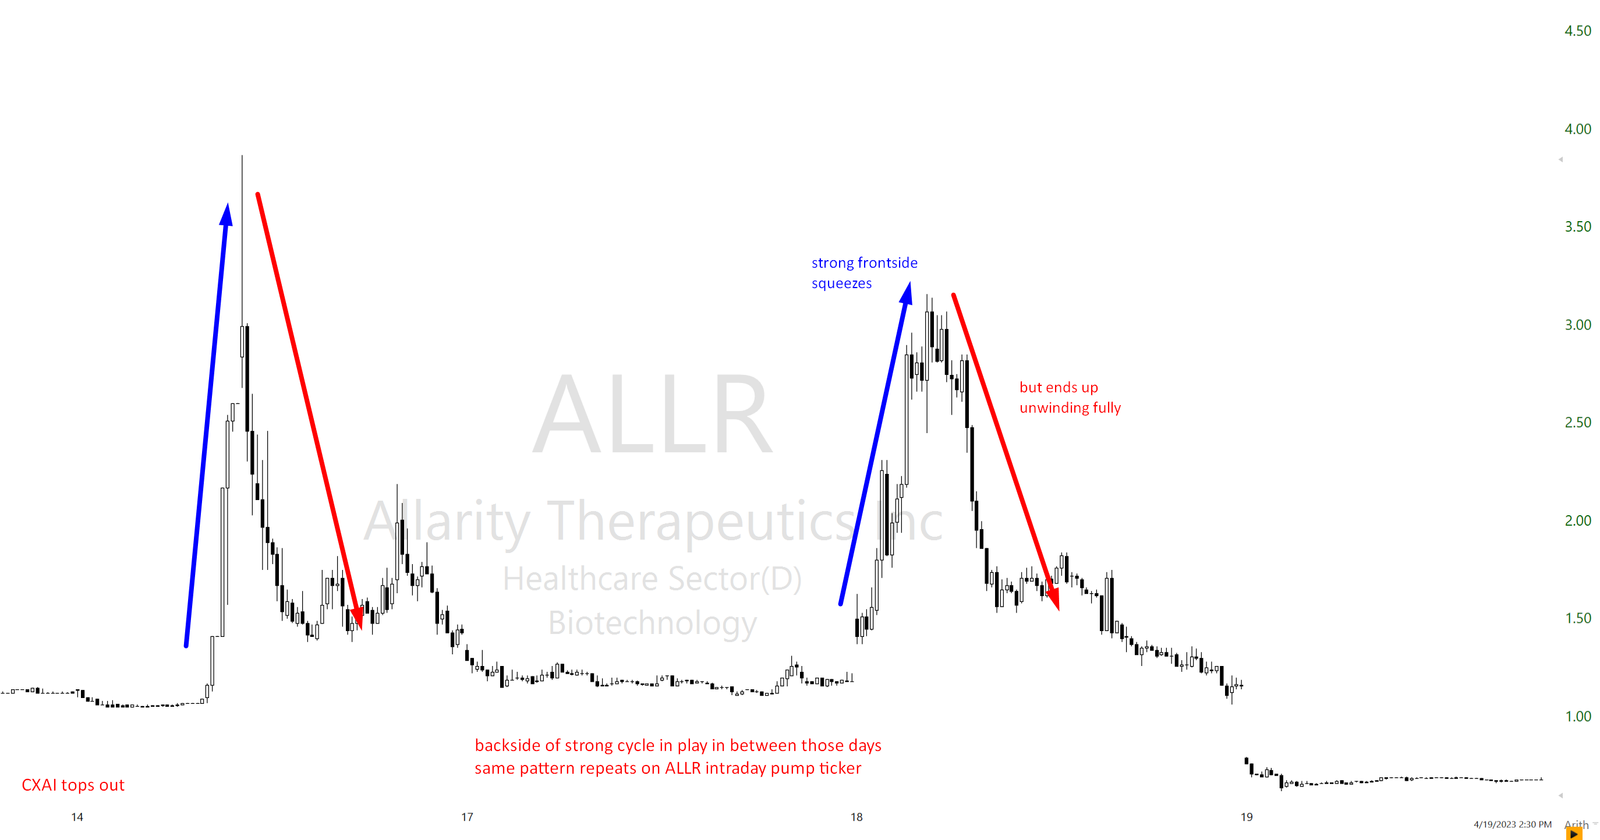
Examples of such recent tickers with inverse U move patterns of the Aprils strong cycle unwind stage were:
ALLR, DRMA, PHIO, TORO (all on the same day). DRMA (ADF ticker) below:

PHIO below:
ALLR below:
Some tips:
Leave your excess skepticism outside of trading office in early stages of strong cycle

Get rid of critical thinking in Stage 1 or 2 of strong cycle for PR / news analysis. Short sellers often like to be very skeptical of catalysts which is correct in most cases but not at early stages of strong cycles.
Anything with mention of a hot (sector) theme in the news release for that stock could turn it into a major runner. Sometimes even the fact that the company belongs to the hot theme sector and has no catalyst will be enough to turn it into a major runner.
Make sure to downgrade your critical thinking specifically in this stage, think of yourself as a stubborn 18y old with perhaps little awareness of market functioning and how you would look at news back then. That’s how you should operate, but again only in this stage of excess (early) bullishness. This is the euphoria stage of the strong cycle, make sure you don’t miss out on long opportunities due to deploying too much skepticism at the wrong time, or even worse shorting too early due to deploying the same at the wrong time. But it goes without saying, this stage lasts usually not more than a week, so be flexible with switch ON-switch OFF mindset.
“Be afraid of nano floaters” as those are mainly strong cycle lead squeezers.
This is common misconception. Many strong cycles leading or big squeezing tickers are not nano floaters but within range of 5 million shares float, where many many other smallcap tickers are as well. Creating “carefulness” criteria based on just nano float information can create a blind spot because many non-nano floater tickers can turn into major squeezers just as much, or become cycle-leading tickers. To keep it straight and blunt, yes nano floaters have a higher chance, but do not underestimate any ticker just because it is not the nano float category. In my view, sorting tickers by float to estimate massive runner potential is not very effective, it does not punch above the noise (randomness) enough. At least not enough to be implemented as super straight-forward rule.
Overstaying on backside of strong cycle

The leading cycle ticker has topped out and collapsed (CXAI on April 14th for example), surely there will be something else repeating that same high % move as momentum is still hot?
This is a common misconception, as wishful thinking or overstaying of traders will misjudge the situation. In most cases when the leading cycle ticker (CXAI in a recent example) tops out (after major parabolic run) and collapses 50%, there won’t be any other leading ticker that picks up the torch and re-lifts the cycle back into its glory. Not at least unless we are talking about 2021 in exceptional liquidity conditions where this was happening. Any other year it’s unlikely.
Be willing to let the strong cycle go into the graveyard of smallcaps fluff material and have its rest once the leading ticker has collapsed, and don’t overstay your hype and excitement. This is key as it usually leads especially bulls to problems.
Identify which ticker is cycle leading ticker (1). Identify when it has completed parabolic run (2) and hit close to 1000% run from its base up (3). When all those markers are checked true, your excitement and expectations should start to shift significantly afterwards for next days. This is likely the cycle top, usually at least.
Example of top on strong cycle of April, when CXAI went parabolic the day before and in after hours next day, reaching 1000% and then topping out the cycle flows right there the next day:

Swing shorting in the strong cycle: just DONT if still a beginner.

A very common mistake is that traders will see tickers with plenty of “meat on the bone” during strong cycles (tickers up 300% on the day), and think that this makes them excellent swing shorting opportunities.
For a whole month, they had to sit through idle and cold market conditions where not many tickers were interesting swing short opportunities because ranges were limited in weak cycles. So when a strong cycle shows up early, many get excited by finally “new / good opportunities” after prolonged hibernation phase. This is a common mistake that happens due to a lack of opportunity present for prolonged time in market and then being unaware of cycle shift and needed adjustment on range expectations.
In the early stage of strong cycle tickers typically do not like to fade much and more importantly like to squeeze on very thin volumes into huge % moves in after-hours or pre-market sessions.
Those tickers tend to do significant damage to anyone swing shorting as often it’s not possible to cover position before its too late, for example, CXAI’s recent example where ticker gapped up from 7 to 70 in AH/PM session the next day. Even if you got a few tickers right by swinging them before, one ticker like that will destroy your account equity. And this kind of move happens all the time specifically in the early stage of strong cycles. It repeats over and over again if you stay with smallcaps long enough.
You would have thought the 2021 ranges were strange, well in 2023 tickers such as CXAI and some 2022/23 IPO tickers (HUDI, TOP, …) went up even in a higher range than in the liquidity craze era of 2021. For example, CXAI and TOP went up 4000-5000% from the base of day 0, which is a lot even for 2021 standards.
This goes to show that there is no such thing as % max estimates for smallcap tickers. Yes, there are averages for sure. Most strong cycle igniting tickers will top out at the 1000%-ish range, but some will go higher every several months. It’s those few that always require you to be on top with a risk management approach.

It requires a good understanding of how the typical leading ticker of the cycle behaves to justify swing shorting it, and usually, that means recognizing the top well (after 1000% run) and joining on the backside to swing short. This is not beginner timing material, it requires perhaps 3 years of good tracking and research of small-caps to do it well on consistent basis. This is why the better idea is not to attempt swing shorts at all in strong cycles until you have gathered your experience in small-caps and an understanding of specifically how strong cycles work.
The main reason why avoiding is a good idea is that on average traders do not adapt their expectations fast enough (due to lack of experience and recognition, since figuring cycles is the most prolonged and difficult aspect of smallcaps perhaps).
They often carry prior cycle expectations of ranges into the new fresh cycle, underestimating how far can now tickers go (which can be up to 10 or 20 times more in strong cycles for AH sessions than any other cycle).
For example, majority of times tickers in AH if they squeeze won’t get far, and are more likely to fade somewhat. But small chunk of all tickers through the year will have a huge change of AH potential, and those usually come clustered around strong cycles.
If trader swing shorts with prior data while not adjusting to the new cycle early you might get caught by a few of those early huge AH squeezers. That is again not theoretical, it is what happens often to swing short traders. Once you have grasped enough experience to understand cycle behavior only then swing shorting should be applied in strong cycles.
If you think about it through reverse engineering it all makes sense. If most smallcap (running) tickers fade over next few days, including those that close up strong on the end-of-the-day, then why is not swing shorting very easy and approach that everyone flocks towards in small-caps? It’s exactly because of that strong cycle dynamics that is such a huge component of avoiding big squeezers that makes it in reality difficult.
On the bright side, swing shorting in unwind stage of the strong cycle (second day after leading ticker tops out), in the first few days of its backside of such cycle is usually a great idea, but again requires experience of seeing cycles many times over to recognize the timing.
Contextual example on where if one really must swing short tickers, in the context of leading ticker topping out:

This was in context of when CXAI topped out and then offered some decent swing shorts on tickers following: MRAI and CNSP. This applies to tickers that started to run prior to or at same time as leading ticker (CXAI) as well as it does to any new D1 gappers for next few days (likely to turn faders).
CXAI reaches over 1000% run in AH and collapses on same day:
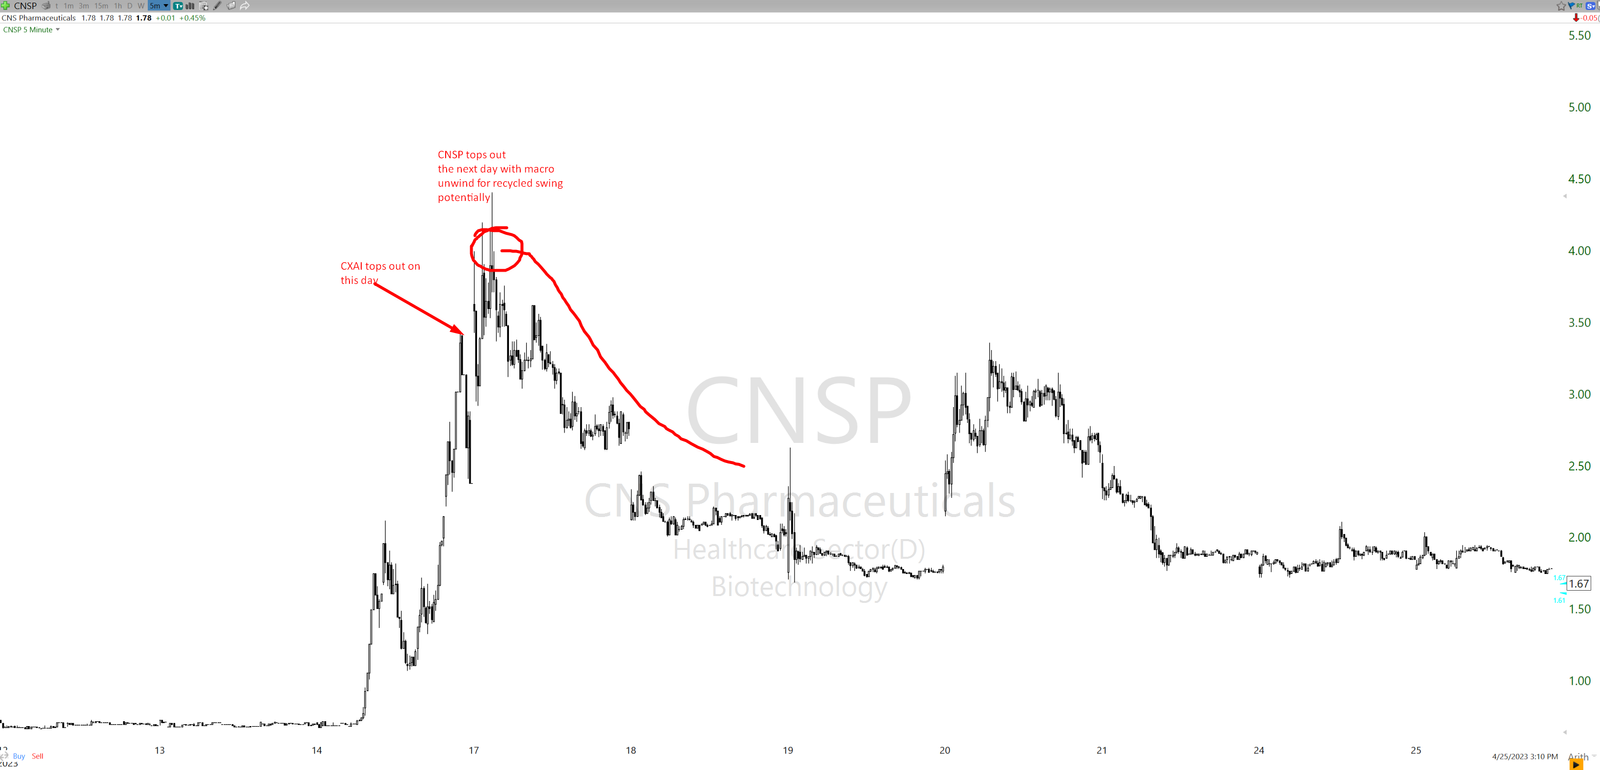
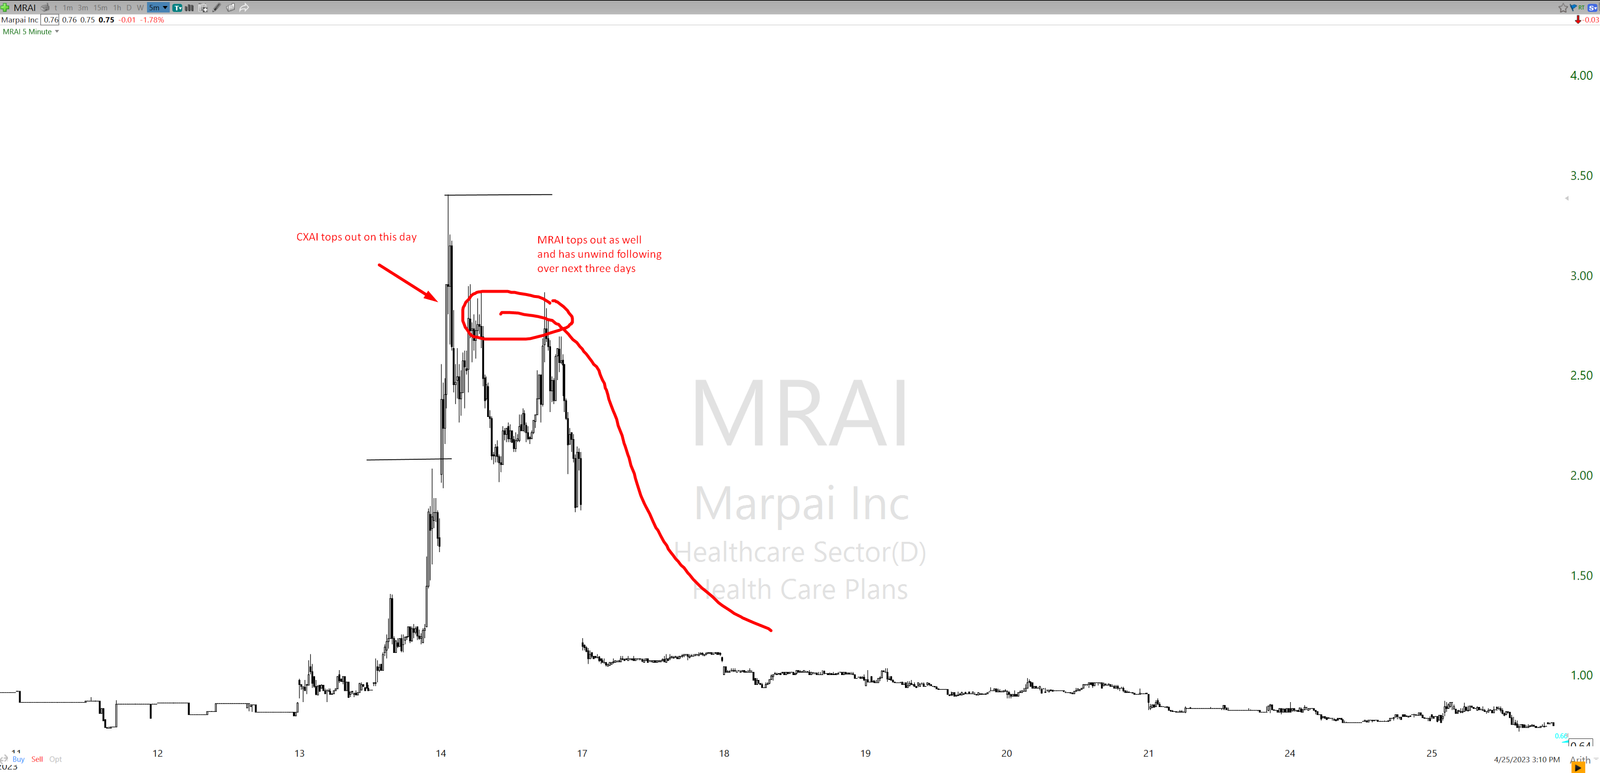
First few days after leading ticker collapses 50% from top down or reaches +1000% from base up (either or, or both) is when fade momentum will set in, providing some good swing shorting opportunities usually as key conclusion.
Swing longing in the early stage of a strong cycle (leave your critical thinking outside of trading office)
In my view, this (strong cycles) is the best time of any in small-caps to swing long tickers. There is no other period of any other cycle stage that justifies swing longing more than stages 1 and 2 of the strong cycle. Mainly because the risk-to-reward will be the highest at that time, even if longing a little late. However, the difficulty of taking longs for many comes from the mindset of “this ticker is probably up too much”.
This reasoning is typically derived from average performance of smallcap tickers, where 150% intraday runner is unlikely to have much more to deliver on upside. Yet in strong cycles they often do, and usually two tickers will go near or above 1000% (from their base lows of d1). There is still large RR gap between 150% and 1000% therefore to extract. However that assumes you do not fight and overstay tickers that end up fading, because not many (of total tickers in strong cycle) will end up being large squeezers above 400%.
Most tickers in early strong cycles will have decent % intraday runs and close strong and then deliver possibly even bigger after hours run (AH run). To bring yourself into the mindset of longing around the market close ticker up many % is not easy (especially for short sellers). It goes against the humble or critical/objective reasoning of ticker valuations. To swing long ticker that has just closed up 200% on the day for anyone who understands the short side of the game just seems ridiculous. Yet that is how it works in strong cycles when the ticker as such might go from 250% to 600% in AH (after hours) run the next day. But again it all comes down to cutting those that do not work, because at least 7/10 will not of total tickers in strong cycle. And this assumes you have recognized the cycle well in first place (not mistaking one solo semi-impressive ticker in weak cycle as strong cycle igniting ticker).
This is not suggestion but my personal approach has been over past 3 years, once very early strong cycle is recognized, deploying AH swing long if ticker:
-Belongs to hot sector theme (AI sector recently for example)
-Has strong close into minimum +150% intraday move
-Has traded very high volume intraday (50 mil shares minimum).
All those criteria have to be meet, and if they are i might attempt AH long. Majority of biggest squeezers in smallcaps, the leading tickers of strong cycles share those three mentioned variables. This isnt all that it is to it, but it is a start. Meaning, if ticker does not meet above three variables its chances to close strong and then next day or in after hours turn into massive squeeze is not high. Its chances are by default higher if above three variables are met.
But it goes also to point out again, not many tickers in each strong cycle will do this. Only a few usually within entire cycle (5 out of 30). Do not expect to catch 15 tickers in good AH/PM runs or multiday runs that go up 400%, because only a few per cycle do. This requires a lot of patience and an even more sour mentality where you know when it’s enough. Knowing when it’s time to stop because you have seen those cycles many times before. What is meant by that is, be aware if cycle has perhaps already exhausted too many huge runners too quickly. If you have noticed that “5 out of 30” sample already being met then consider no further swing attempts. Because in some strong cycles major squeezers all show up early but then the cycle is done fast and exhausts too quickly. Overstaying swing longs after those 5 strong squeezers are done is common mistake for beginners on swing side of smallcaps, not paying attention to “exhaustion variable”. By 5 out of 30 it is meant broadly, 5 tickers that go above 500% total squeeze range (from their base up on day 0).
Personal tip if you deploy this approach: You will never sleep well when being swing long any ticker as such (especially longing at high price on market close). No matter how many strong cycles you have seen, swinging long into the market close (at a high price) something that might gap down a lot the next day (or deliver offering even worse) is never a good night’s sleep, regardless of how much upside potential there might be, and regardless of how selective and reasonable you are on selecting the ticker. It’s always a struggle and, to be honest, the next day it always puts a bit of a smile on your face when the thing is up a ridiculous amount of % (if). Make sure that position is sized correctly as well, keep it smaller so that 1R does not respresent too tight cent distance.
This is not beginner friendly method at all to add. It requires good understanding of cycle timing, and even after that it never gets easy. But it is doable if being very patient and selective. And by patient its meant for entire month not deploying any trade for that approach just to deploy it then early into strong cycle on next 5 to 8 tickers. And then back to idle stage for entire month once more. This is the amount of selectivity needed. Large gaps of idle no-setup deployment in between.
Example of trade distribution on this approach:

Never think about % maximums in strong cycles.
Smallcaps can be very deceptive because most times the ranges (% runs that tickers achieve) have some sort of order to them. Tickers stay on average month within certain ranges (“boxed in”), and then as well squeeze intraday only up to a certain average amount. Within weak and neutral cycles those ranges tend to have a certain thread-line to them.
When the strong cycle shows up, all hell breaks loose. Ranges expand out of prior context significantly.
Distribution of ranges in smallcaps is often “capped within a box” around 70% of time, and then about 10-20% of time usually all within strong cycles that “capped box” is no longer applicable, because the ranges explode out of their past norms. Understanding that this happens cyclically (is not just one type of thing) helps one to shift expectations out of boundries once in a while, to not be surprised by it and understand that when three such tickers show up, this probably is not the end yet, there will be more to come.

It is this escape in range velocity that hurts so many traders on short side. They get used to long lasting context of boxed range (lets say 80% average runner intraday) that when change happens they get caught by surprise.
And not just that, they underestimate how long the change will last, typical expectation is that “it will just be one strange ticker” yet often its a cycle with many continous samples of those unusually high ranges. This is where recognizing that this indeed is start of new cycle early comes into play to provide one with right mindset early before its too late. And the same can be said for long (bullish) traders, they overstay their expectations often in late stage of strong cycles. If you research the range hold-up rates historically which correlates with strong cycle durations, one can tell those periods do not last for long. When the period has lasted for 10 days already chances are, this is it. Yet many bulls will now get under wish-full thinking hoping that those 10 days stretch into 30 and more of this explosive 300% movers. This is why marking down aproximately when exactly did strong cycle begin is beneficial information as it provides context of max potential duration likely.

Strong cycles are when ranges break out of their prior averages significantly (doubling the prior avg range per day) and it can become very detrimental for a short seller to operate with prior (different cycle) data to conclude what is or is not possible within the current new strong cycle.
This is where the ticker might start squeezing 150% early, where most will assume “This is getting a bit ridiculous” using the rear mirror of different cycle data (since nothing squeezed that fast for past 40 days) as a reference point, and before you know it the 200% ticker is now parabolic at 450% on the day.
Something to remember is that ranges will double up by default at a minimum in strong cycles. So will the volumes and liquidity.
Day 1 gapping tickers will no longer just gap up 50% in pre-market (avg in some weak/neutral cycles), but instead 100%.
Intraday runners (pumps) will not go up 70% and top and unwind (as often do in neutral cycles), but instead, now they go up 150%.
The ranges double up. Recognizing the new cycle early is very important to build that expectation ahead and avoid early shorting, and perhaps consider some early longs into frontside of the move, or what some might call “chasing”. I do think that there are rare situations where chasing is okay if cycle conditions are just right for it (which is only 10% of the total time).
So the key is to go into every single trading day when you know that a strong cycle is present with a very very open mind, and a full awareness that ranges will double up from what you were used to just a month ago. And that something soon enough will explode 1000%, as it always does in strong cycle.
And just as that will be true, the ranges will also then shrink back down before you know it once the strong cycle tops out (after one ticker passes 1k% parabolic move). Usually, 5 days later ranges are back to their old “boring” low volatility once more. So do not overstay your expectations.
Experience versus research and backtesting mistakes

It is fair to say that experience in seeing the strong cycles many times over to differentiate behaviors to other market conditions is necessary.
As much as research and backtesting are highly valuable in markets, the experience of seeing those flows live just cannot be replaced with research only. It is hard to explain exactly why. Perhaps because there are so many details that go into live analysis and seeing it playing out which just does not translate well on backtest or historically collected data.
It is also a fact, for one to create filtered and refined data in small-caps, splitting it across the cycles is necessary. However, this complicates the process a lot. Collecting and sorting tickers historically and sorting them into different cycles can be very challenging and time demanding (this is why it is easier doing it live on daily basis rather than historically). Yet, it is necessary if one wants to avoid making mistakes of averaging data too much and pretty much-creating strategies that are strong-cycle-exposed with severe weak spots.
Strong cycles do the most damage to both long and short traders on average. If that’s the case, then what is one thing that most traders do not do when creating backtests or data collection for their strategies? They do not sort the data (tickers) per cycles.
This always creates an element of surprise when a strong cycle shows up and destabilizes their expectations, because their backtest tells them that “strange runners” do not come in clusters, or should mean-revert faster than they actually do.
This is because if backtest is sorted per cycle, it would highlight the strong cycle frequency and dangers they present (such as high cluster of strong runners (issue for short sellers)).
If however, data is collected and mixed with no sorting of tickers per cycle, then large % runners hide between all the mush of low % runners (on low volatility) which are much higher in numbers of samples. Yet those high % runners often tend to come in the cluster and not isolated!!!
Make sure to re-read above twice if needed to understand just how important the above is and how it creates all sorts of issues in smallcap trading environment. And while the issue above is pointed out as problem for short sellers, it also translates to bulls. Bulls tend to think that after cluster of large % mover has happened that it is normal to expect this becoming a new status quo of continuous “prints” of such tickers in a row. Yet it is not. All clusters end, soon. Average duration of clustered runners in smallcaps is not that high, especially if one has not noticed it early and extract the best opportunities already.
To outline the points rised above, on how large % runners are often distributed in smallcaps:

To highlight the point above:
-Collecting 100 consequent samples show that there are some extraordinary % runners in that larger sample base.
But what if you were told that those are usually not randomly distributed in sequence (spread out and spaced out), but instead usually clustered together, mostly within the same week of action?! If so how would that impact your strategy assessment, risk profile, size distribution, adaptivity on weekly basis, etc?
Mistakes compounding effect
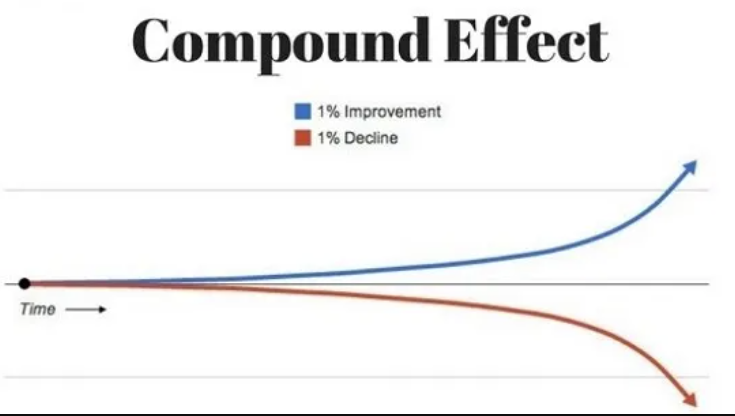
For a discretionary trader who makes X amount of mistakes on weekly basis, the effect of mistakes is multiplied many folds on a highly volatile strong cycle (for sloppier traders), due to a cluster of unusual activity coming all at once, rather than being spaced out.
Mistakes compound in the negative results they leave exponentially if they are too clustered together (too many at once) just as positive gains can compound exponentially in positive manner. It works the same both ways.
An organized trader aware of strong cycle mechanisms might be alright but a beginner or disorganized trader unaware of strong cycle mechanics might be under much higher negative exposure to mistake-compounding effect when strong cycles appear.
The factor above on how larger % movers (in AH/PM and intraday) are distributed over continuous 100 samples of tickers highlights just why tracking strong cycles is so important.
A common mistake that systematic traders make is to short within the boundaries of robotic systems, thinking that one can just ignore strong cycles (“just stick to the system”). This is incorrect, because mistakes and losses in strong cycles will compound too much, and can within 2 week period multiply and do plenty of damage to equity (wiping out 2 months of gains, which they often do). Stopping out 1 major runner 10 times sounds bad, but what if there are 4 more following, and the trader repeats a similar mistake on 3 additional ones?
For long biased traders we could list different issues, one common being overstaying. Scalping and chasing front sides of stocks with longs thinking they will last forever not being aware of strong cycle exhaustion and then longing tickers (with same approach) way too far outside of strong cycle when the momentum has already dried out completely.
The mistakes can quickly compound early into a strong cycle (for shorts) just as they do on the backside of the strong cycle (for longs). From my years of observation of small-caps, this is why no one can afford to ignore the mechanics or recognition of strong cycles over the long run, even that many will just prefer to swipe it under the rug “its just a short term crazy period”. Maybe, but the damage done is crazy real.
What should one track for cycle uptick/downtick recognition?

Some about that has been written in older articles, but the quick summary is:
1. AH runners.
AH, runners are perhaps the most unique variable of strong cycles. They do not appear outside of strong cycles (at least not above 100% runners) and especially not in higher than just one sample. If you noticed AH runners (3 in a row) that is a very likely indication of stronger momentum flows. Strong cycle has already or is just about to began in such case.
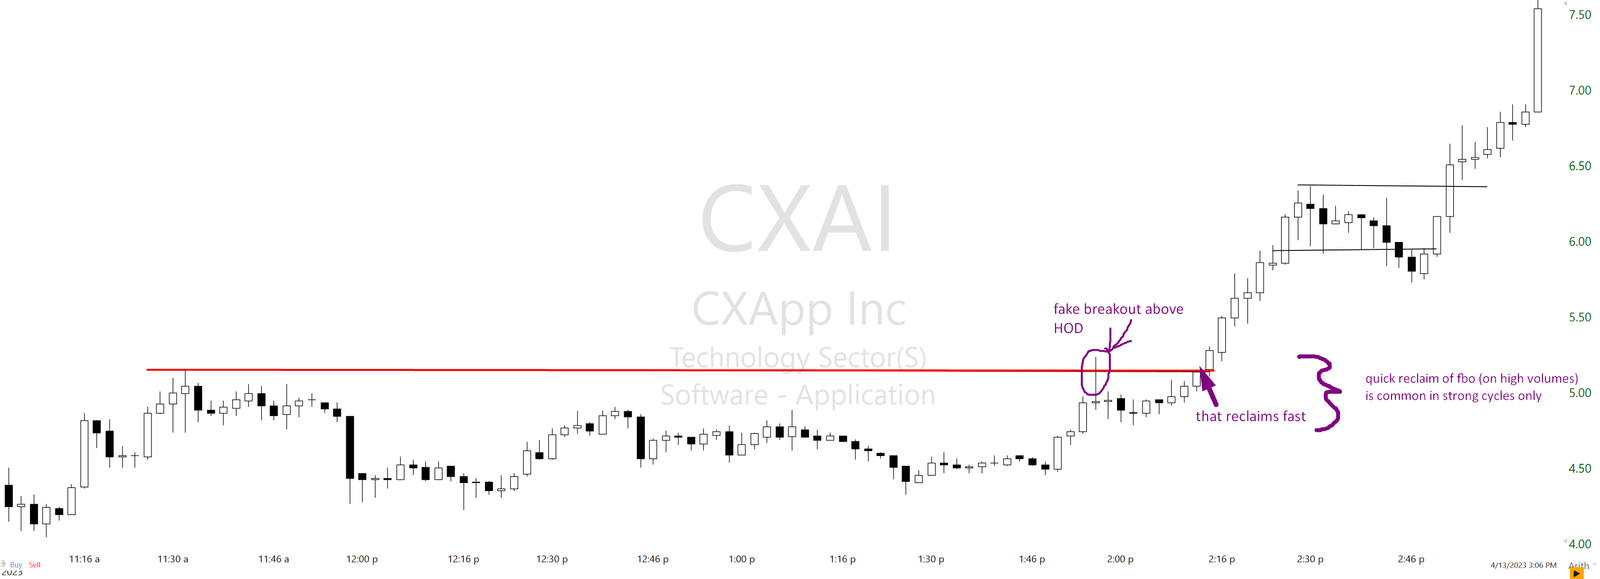
2. Fake breakouts that reclaim fast.
Typically in small caps when the ticker completes a fake breakout and rejects under the HOD level there will be a slow unwind following.
If the ticker reclaims the fbo candle fast that is common within strong cycles mainly and more rarely happens outside of them. It is an indication of an uptick in cycle flows. Demand has more firepower to go still is what it highlights often. Obviously no pattern is guarantee but it has enough statistical significance to include it as cycle-uptick confirmation.
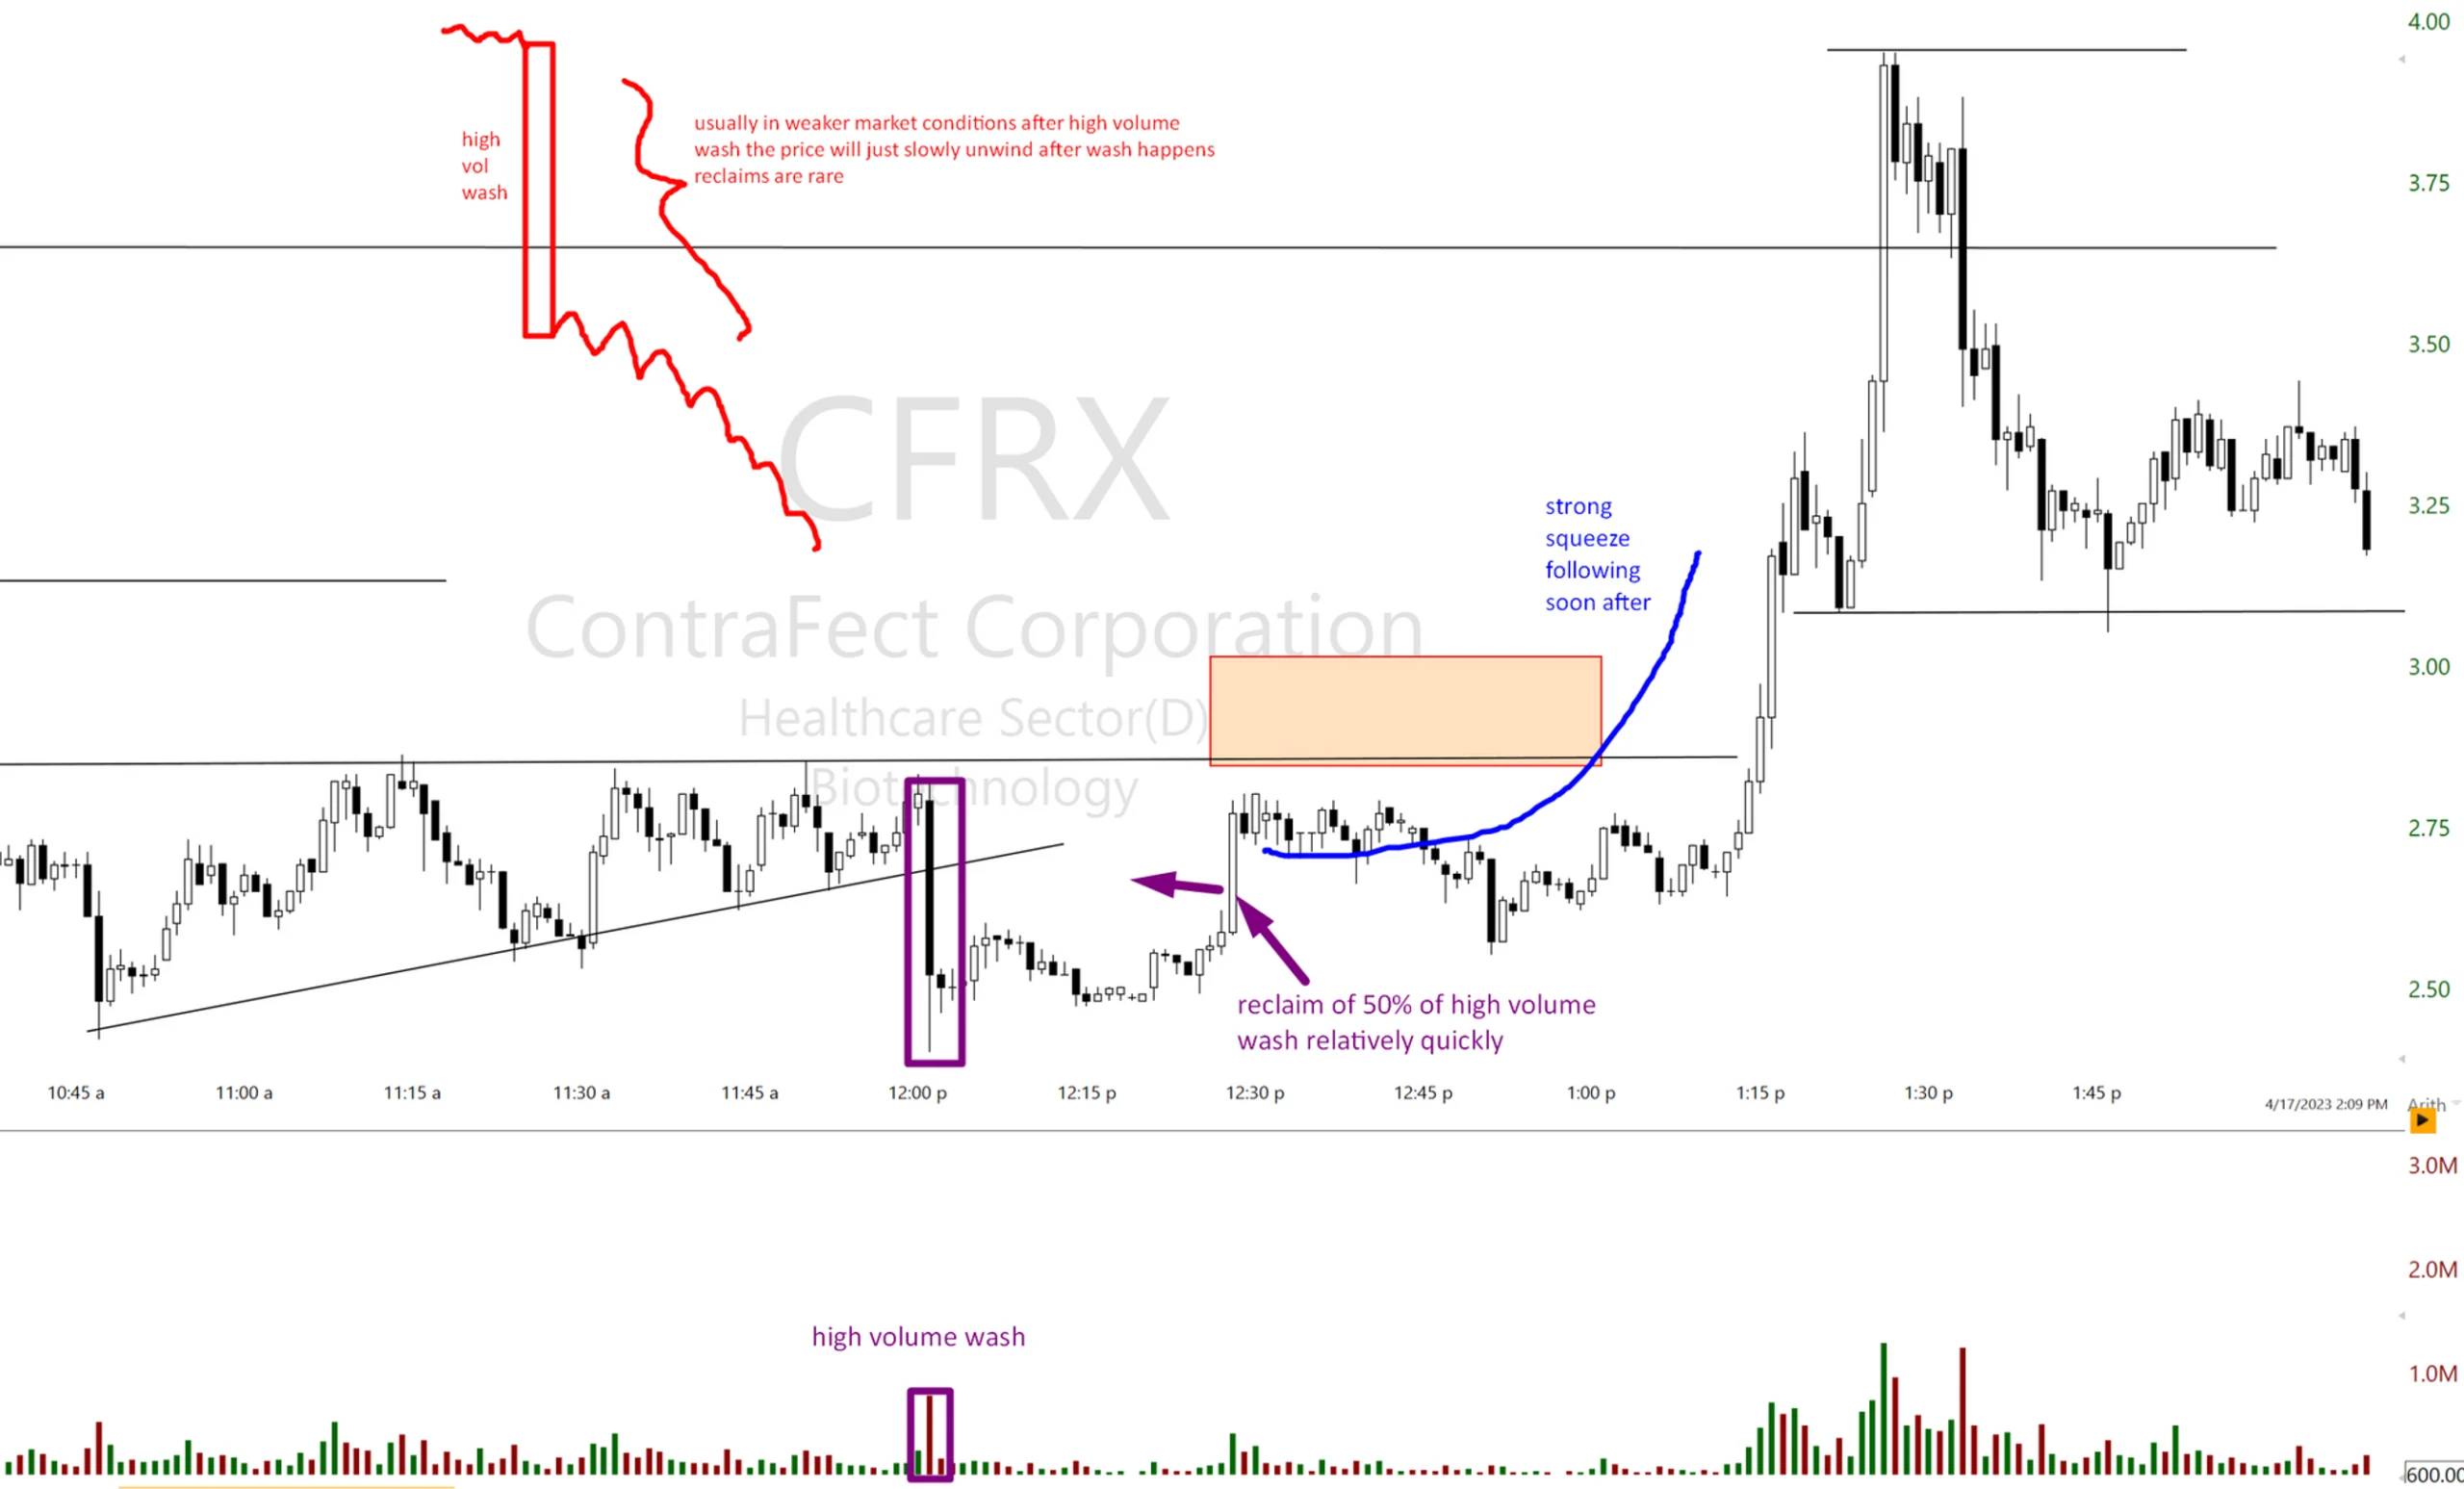
3. Heavy washes on high volume that reclaim fast.
Typically when the ticker flushes out plenty of volume, the momentum will head south or become neutral. If such a wash candle is reclaimed fast it shows excess demand is present. It is one of the common behaviors of strong cycles. If you spot such behavior a few times in a row (not just once) it indicates a good potential for uptick in cycle flows. Seeing it happen once is not strong factor, but if happens 3 times over span of two days that is a considerable factor.
4.”Hot sector theme” presence.
Some industry in broad markets that is getting a lot of attention is now igniting the sector in small-caps that relates to it (AI for example recently). When many tickers start to PR with the same “hot sector theme” news releases, that is an indication of a cycle uptick. Yes the bullshit fluff factor upticks as well, but hey that is aswell directly correlated to strong cycles.
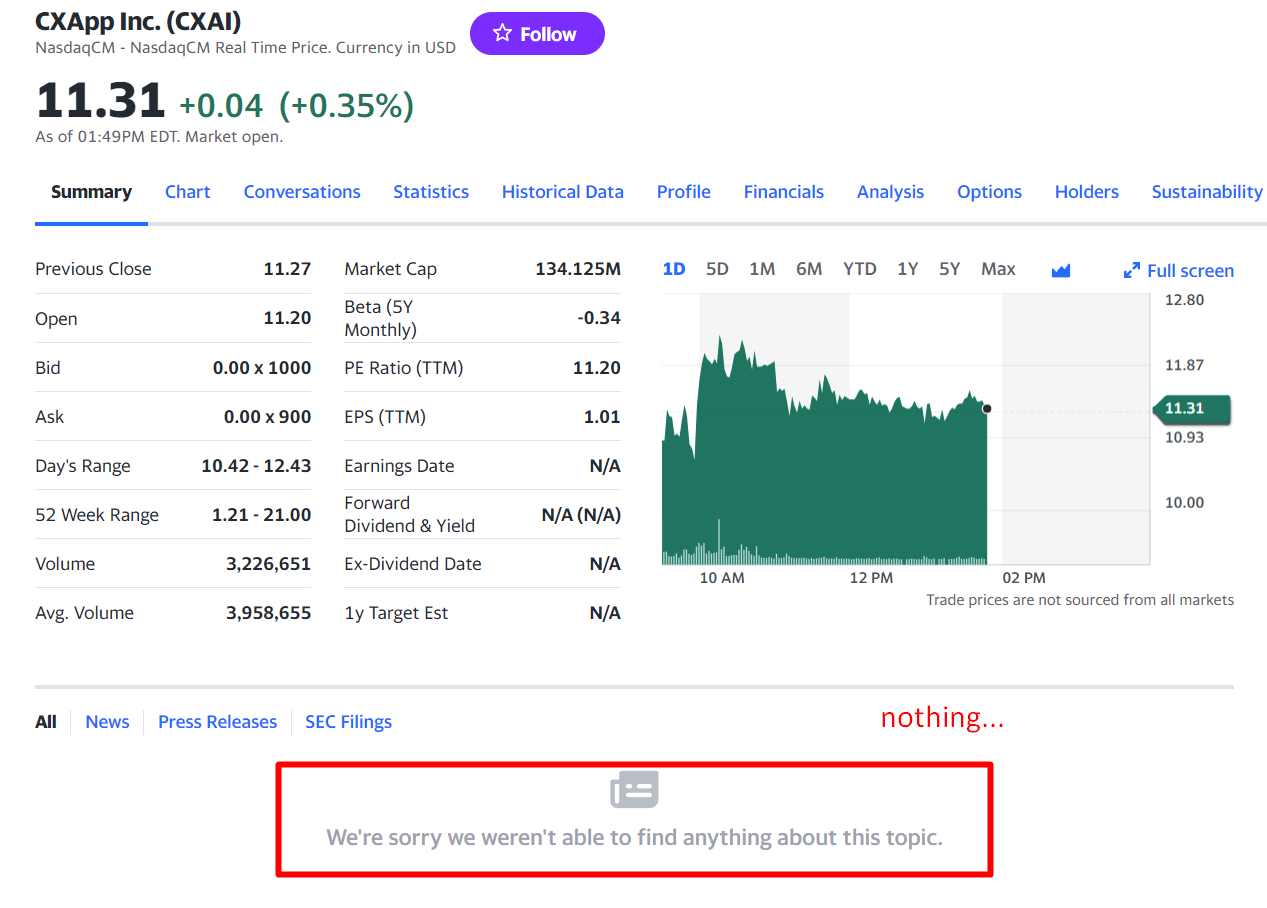
But keep in mind, do not be focused just on catalysts, many tickers that run are within hot sector, but do not have any fresh catalysts related to it specifically. Yet they still have potential to run, such as CXAI recently, no news, just AI sector, yet the ticker had massive run:
5. High % runners (150%+). Duh? This is the easiest one, but the most deceptive, because high % runners on their own do not confirm strong cycles well. All the above-listed variables should be in play at once to confirm a proper uptick in cycle momentum. This is because a high % runner (one sample) can show up in a weak cycle as well (350% intraday runner) that then 5 hours later completely collapses. This is very common that traders will mistake this as the start of a strong cycle not being aware that all other above variables are just not present therefore there probably won’t be follow-through on the strong cycle.
Make sure to read other articles that connect to the variables mentioned above and track them on tickers daily, to recognize when cycle flows are up ticking or down ticking daily to spot the strong cycle changes early. Both in front and back sides.

To track cycle changes get rid of the hot chick mentality and jumping into new day with a clean blank slate and no clear recollection of past days tickers movements like someone from Men in Black using a memory eraser after market close each day.
Instead keep behaviors collected daily, and notice shifts in momentum or specific patterns so that context highlights the cycle uptick/downtick and what is likely next to come.
Conclusion:
The above example of a recent strong cycle provides some practical backdrop to explain the behavioral examples of tickers. Those cycles are the most interesting and exciting period to trade within small-caps, but they bring their own set of behaviors and changes. Those behaviors are often very different from prior norms and should be taken as separate. Many patterns that appear in the strong cycle just do not appear at all in weaker market conditions of small caps such as (check other articles for those mentions):
-parabolic squeezes on 300+%,
-type4 clearouts,
-heavy wash reclaims
-and fake breakout (quick) reclaim
This means that traders should get with a very different mindset into the day of the strong cycle than any other day when momentum and volatility are softer.


56 thoughts on “Smallcap stocks strong cycle overview (April 2023-AI theme)”
Great intel thanks for explaining all of this to us. I have learned more from you than any other independent trader on twitter in the last 10 years.
Oh, man! Amazing content, Jan. Been following your blog for years but this article is just perfect for what I’m currently working on. I’m putting together an updated version of my forward tester and deciding on how I want to rank the current smallcaps cycle/environment. As I was reading your article I kept jotting down some questions and then I’d read the next paragraph and you’d have the answer to it! Really appreciate your work and how much you share.
I’m curious granular you get when trying to quantify the currently cycle. Is it more of a 1-5 ranking system based on the variables you shared combined with feel/intuition? Or do you strive for a more detailed score (ex: 1-100) based on quantifiable metrics for each variable? Feel free to add me on discord if ever wanna chat more: Mr. Tropicana#5929. I’ve been trading full-time since 2017 and happy to connect. Cheers!
Hey, thanks! Yes the system works more or less with 1-10 scoring, and it has combined intraday adjustments to it which are feed through tickers performances. In most cases end-of-the-day input is all you need, because through most days the cycle scoring should not change much. But there are days such as early strong cycles or bust of strong cycles (tops) where youll need to adjust on intraday basis, and those days can be very sharp in moves. To keep it short, EOD scoring is where you should start, but over time (year or two) adjusting to intraday adjustment has benefit to adjust quickly to those cycle-ignition days and minimize damage.
I believe that detailed scoring has benefits for sure, but you have to think it through very well, and you have to do homework every day if you want to have detailed scoring. I avoided that for now because it takes bit too much of time and makes it annoying to run too detailed daily exercise, so i find balance somewhere in the middle. Once you make process annoying you ensure you will fail at following it eventually.
Detailed scoring can help if you track sub-patterns of each cycle, but for that you need to know how to structure exercise properly and sort all patterns ahead, which is something that takes plenty of experience to figure out.
Keep up the fantastic work! Kalorifer Sobası odun, kömür, pelet gibi yakıtlarla çalışan ve ısıtma işlevi gören bir soba türüdür. Kalorifer Sobası içindeki yakıtın yanmasıyla oluşan ısıyı doğrudan çevresine yayar ve aynı zamanda suyun ısınmasını sağlar.
BWER sets the standard for weighbridge excellence in Iraq, offering innovative, reliable systems and dedicated support to ensure optimal performance and client satisfaction.
Can you be more specific about the content of your article? After reading it, I still have some doubts. Hope you can help me.
Thanks for sharing. I read many of your blog posts, cool, your blog is very good.
Your article helped me a lot, is there any more related content? Thanks! https://accounts.binance.com/ar-BH/register-person?ref=V2H9AFPY
Thanks for sharing. I read many of your blog posts, cool, your blog is very good.
I don’t think the title of your article matches the content lol. Just kidding, mainly because I had some doubts after reading the article.
Your article helped me a lot, is there any more related content? Thanks!
A code promo 1xBet est un moyen populaire pour les parieurs d’obtenir des bonus exclusifs sur la plateforme de paris en ligne 1xBet. Ces codes promotionnels offrent divers avantages tels que des bonus de dépôt, des paris gratuits, et des réductions spéciales pour les nouveaux joueurs ainsi que les utilisateurs réguliers.code promo 1xbet benin
Thanks for sharing. I read many of your blog posts, cool, your blog is very good.
Can you be more specific about the content of your article? After reading it, I still have some doubts. Hope you can help me.
Your point of view caught my eye and was very interesting. Thanks. I have a question for you.
I don’t think the title of your article matches the content lol. Just kidding, mainly because I had some doubts after reading the article.
I don’t think the title of your article matches the content lol. Just kidding, mainly because I had some doubts after reading the article.
Your point of view caught my eye and was very interesting. Thanks. I have a question for you. https://boysahoy.com/peanut-butter-jelly-cream-cheese-ball-and-10000-kitchen-makeover-giveaway/#comment-248883
I don’t think the title of your article matches the content lol. Just kidding, mainly because I had some doubts after reading the article. binance
Thanks for sharing. I read many of your blog posts, cool, your blog is very good.
Your point of view caught my eye and was very interesting. Thanks. I have a question for you.
I don’t think the title of your article matches the content lol. Just kidding, mainly because I had some doubts after reading the article.
Very nice post. I just stumbled upon your blog and wanted to say that I’ve really enjoyed browsing your blog posts. In any case I’ll be subscribing to your feed and I hope you write again soon!
Thank you for your sharing. I am worried that I lack creative ideas. It is your article that makes me full of hope. Thank you. But, I have a question, can you help me? https://www.binance.com/si-LK/register?ref=V2H9AFPY
**mind vault**
mind vault is a premium cognitive support formula created for adults 45+. It’s thoughtfully designed to help maintain clear thinking
**mindvault**
mindvault is a premium cognitive support formula created for adults 45+. It’s thoughtfully designed to help maintain clear thinking
**glpro**
glpro is a natural dietary supplement designed to promote balanced blood sugar levels and curb sugar cravings.
**sugarmute**
sugarmute is a science-guided nutritional supplement created to help maintain balanced blood sugar while supporting steady energy and mental clarity.
**vittaburn**
vittaburn is a liquid dietary supplement formulated to support healthy weight reduction by increasing metabolic rate, reducing hunger, and promoting fat loss.
**synaptigen**
synaptigen is a next-generation brain support supplement that blends natural nootropics, adaptogens
**glucore**
glucore is a nutritional supplement that is given to patients daily to assist in maintaining healthy blood sugar and metabolic rates.
**prodentim**
prodentim an advanced probiotic formulation designed to support exceptional oral hygiene while fortifying teeth and gums.
**nitric boost**
nitric boost is a dietary formula crafted to enhance vitality and promote overall well-being.
**sleeplean**
sleeplean is a US-trusted, naturally focused nighttime support formula that helps your body burn fat while you rest.
**wildgut**
wildgutis a precision-crafted nutritional blend designed to nurture your dog’s digestive tract.
**mitolyn**
mitolyn a nature-inspired supplement crafted to elevate metabolic activity and support sustainable weight management.
**yusleep**
yusleep is a gentle, nano-enhanced nightly blend designed to help you drift off quickly, stay asleep longer, and wake feeling clear.
**zencortex**
zencortex contains only the natural ingredients that are effective in supporting incredible hearing naturally.
**breathe**
breathe is a plant-powered tincture crafted to promote lung performance and enhance your breathing quality.
**prostadine**
prostadine is a next-generation prostate support formula designed to help maintain, restore, and enhance optimal male prostate performance.
**pinealxt**
pinealxt is a revolutionary supplement that promotes proper pineal gland function and energy levels to support healthy body function.
**energeia**
energeia is the first and only recipe that targets the root cause of stubborn belly fat and Deadly visceral fat.
**prostabliss**
prostabliss is a carefully developed dietary formula aimed at nurturing prostate vitality and improving urinary comfort.
**boostaro**
boostaro is a specially crafted dietary supplement for men who want to elevate their overall health and vitality.
**potent stream**
potent stream is engineered to promote prostate well-being by counteracting the residue that can build up from hard-water minerals within the urinary tract.
**hepato burn**
hepato burn is a premium nutritional formula designed to enhance liver function, boost metabolism, and support natural fat breakdown.
**hepato burn**
hepato burn is a potent, plant-based formula created to promote optimal liver performance and naturally stimulate fat-burning mechanisms.
**flowforce max**
flowforce max delivers a forward-thinking, plant-focused way to support prostate health—while also helping maintain everyday energy, libido, and overall vitality.
**neurogenica**
neurogenica is a dietary supplement formulated to support nerve health and ease discomfort associated with neuropathy.
**cellufend**
cellufend is a natural supplement developed to support balanced blood sugar levels through a blend of botanical extracts and essential nutrients.
**prodentim**
prodentim is a forward-thinking oral wellness blend crafted to nurture and maintain a balanced mouth microbiome.
**revitag**
revitag is a daily skin-support formula created to promote a healthy complexion and visibly diminish the appearance of skin tags.
Logging in to 97cassinologin is smooth as butter, and once you’re in, the games are pretty solid. Good experience overall. Access it through 97cassinologin.
188betvietnam, this is something new for me. I will check it in leisure time. Come and see more details at : 188betvietnam
Your article helped me a lot, is there any more related content? Thanks! https://accounts.binance.com/register-person?ref=IXBIAFVY
**balmorex pro**
balmorex is an exceptional solution for individuals who suffer from chronic joint pain and muscle aches.